Troubleshooting the Microsoft Dynamics GP 2013 Web Client - Part 6
Part 6 - Tools for Troubleshooting Web Client issues: Other Tools
In Part 5 we looked at Fiddler, a proxy web debugger application and how it is able to break down HTTP and HTTPS traffic between a client app and a Web Server. Today, I will look at 2 tools that go down right to the wire - literally!
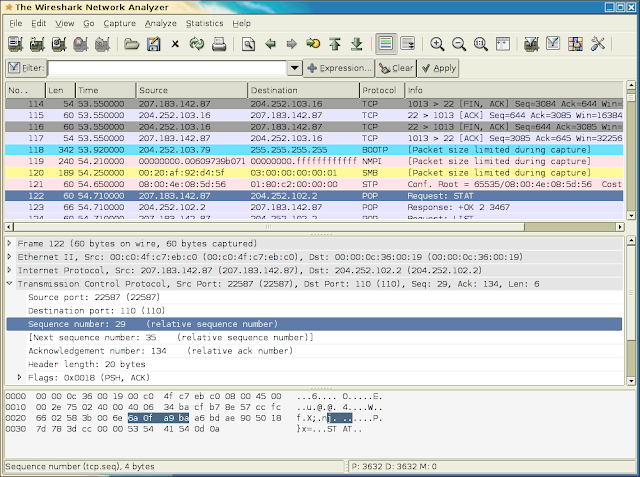
Wireshark
Wireshark is a free and open-source packet analyzer. It is used for network troubleshooting, analysis, software and communications protocol development, and education. Originally named Ethereal, in May 2006 the project was renamed Wireshark due to trademark issues.
Wireshark is cross-platform, using the GTK+ widget toolkit to implement its user interface, and using pcap to capture packets; it runs on various Unix-like operating systems including Linux, OS X, BSD, and Solaris, and on Microsoft Windows. There is also a terminal-based (non-GUI) version called TShark. Wireshark, and the other programs distributed with it such as TShark, are free software, released under the terms of the GNU General Public License.
Wireshark is very similar to tcpdump, but has a graphical front-end, plus some integrated sorting and filtering options. Wireshark allows the user to put network interface controllers that support promiscuous mode into that mode, in order to see all traffic visible on that interface, not just traffic addressed to one of the interface's configured addresses and broadcast/multicast traffic. However, when capturing with a packet analyzer in promiscuous mode on a port on a network switch, not all of the traffic travelling through the switch will necessarily be sent to the port on which the capture is being done, so capturing in promiscuous mode will not necessarily be sufficient to see all traffic on the network. Port mirroring or various network taps extend capture to any point on the network.
So why is Wireshark used with the Web Client? Since it analyzes TCP/IP traffic, you could potentially use it to understand if the proper ports are being used by the application when communicating with the Web Server(s) or the Session Host(s), especially when traffic has to traverse intranet, DMZs, and extranet zones on your network. You could potentially determine if there are any translation issues between external DNS addresses and internal network addresses.
ClearSight Analyzer from Fluke Networks
This product is advertised as Wireshark on steroids as it supports the Wireshark decode engine. In addition, it's able to make sense of all TCP/IP traffic by implementing some powerful graphics showing how machines and devices interact with each other.
ClearSight also implements a powerful bounce chart for traffic on single or multi-segment networks. Now here's the bummer: it's not free! However, for a small fee you are able to obtain a fully featured product.
If you are more like me - a visual person - then ClearSight is certainly worth the price. If you are comfortable in your own skin looking at TCP/IP raw traffic, then Wireshark is the way to go. In any event, you have two powerful tools that can really breakdown your network traffic with ease, for you to analyze where things may be breaking down, preventing Web Client from functioning.
Until next post!
MG.-
Mariano Gomez, MVP
IntellPartners, LLC
http://www.IntellPartners.com/

In Part 5 we looked at Fiddler, a proxy web debugger application and how it is able to break down HTTP and HTTPS traffic between a client app and a Web Server. Today, I will look at 2 tools that go down right to the wire - literally!
Wireshark
Wireshark is a free and open-source packet analyzer. It is used for network troubleshooting, analysis, software and communications protocol development, and education. Originally named Ethereal, in May 2006 the project was renamed Wireshark due to trademark issues.
Wireshark is cross-platform, using the GTK+ widget toolkit to implement its user interface, and using pcap to capture packets; it runs on various Unix-like operating systems including Linux, OS X, BSD, and Solaris, and on Microsoft Windows. There is also a terminal-based (non-GUI) version called TShark. Wireshark, and the other programs distributed with it such as TShark, are free software, released under the terms of the GNU General Public License.
 |
| Wireshark Network Analyzer |
Wireshark is very similar to tcpdump, but has a graphical front-end, plus some integrated sorting and filtering options. Wireshark allows the user to put network interface controllers that support promiscuous mode into that mode, in order to see all traffic visible on that interface, not just traffic addressed to one of the interface's configured addresses and broadcast/multicast traffic. However, when capturing with a packet analyzer in promiscuous mode on a port on a network switch, not all of the traffic travelling through the switch will necessarily be sent to the port on which the capture is being done, so capturing in promiscuous mode will not necessarily be sufficient to see all traffic on the network. Port mirroring or various network taps extend capture to any point on the network.
So why is Wireshark used with the Web Client? Since it analyzes TCP/IP traffic, you could potentially use it to understand if the proper ports are being used by the application when communicating with the Web Server(s) or the Session Host(s), especially when traffic has to traverse intranet, DMZs, and extranet zones on your network. You could potentially determine if there are any translation issues between external DNS addresses and internal network addresses.
ClearSight Analyzer from Fluke Networks
This product is advertised as Wireshark on steroids as it supports the Wireshark decode engine. In addition, it's able to make sense of all TCP/IP traffic by implementing some powerful graphics showing how machines and devices interact with each other.
 |
| Network diagram |
 |
| Conversation Chart |
ClearSight also implements a powerful bounce chart for traffic on single or multi-segment networks. Now here's the bummer: it's not free! However, for a small fee you are able to obtain a fully featured product.
If you are more like me - a visual person - then ClearSight is certainly worth the price. If you are comfortable in your own skin looking at TCP/IP raw traffic, then Wireshark is the way to go. In any event, you have two powerful tools that can really breakdown your network traffic with ease, for you to analyze where things may be breaking down, preventing Web Client from functioning.
Until next post!
MG.-
Mariano Gomez, MVP
IntellPartners, LLC
http://www.IntellPartners.com/


Comments